
Market report, updated

Sign up to stay up to date on the Seaside Plantation Real Estate Market!

Search in the neighborhood of Seaside Plantation, in the cities of Cherry Grove, Conway, Garden City, and other cities

Create your own market report
allmyrtlebeachhomes.com
Report prepared by allmyrtlebeachhomes.com
allmyrtlebeachhomes.com logo

Seaside Plantation

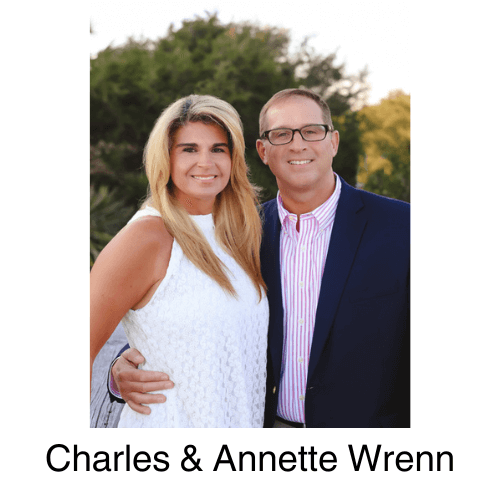
Located two blocks from the ocean with access from 8th Avenue North, Seaside Plantation North Myrtle Beach homes for sale offer 162 home sites on between a quarter and a third of an acre positioned on two lakes. Amenities enjoyed by residents and guests of North Myrtle Beach real estate here include a sparkling swimming pool, jacuzzi, horseshoe pits, putting green, and shuffleboard courts. Sign up to receive monthly market reports on Seaside Plantation or create your own North Myrtle Beach real estate market report right here. The Charles and Annette Team would love to give you a private tour of Seaside Plantation, please call today at 804-690-2342.

Market at a glance

Over the last 6 months, homes sold for 96.6% of list price in 85 days on average.

Average price, last 12 months

What sellers asked vs. what homes actually sold for, by closing month.

List · $765K Sold · $760K
$910K$810K$710K$610K
OctNovDecJanFebMarAprMayJunJulAugSep

Homes sold per month

Closed sales, last 12 months.

Sold tab (last 6 months) Earlier

Peak: 2 sales in Jun. Last month: 2.

Where the market stands

All homes in this report, by status.

11homes
Active2 · 18%
Under contract3 · 27%
Sold (6 mo)6 · 55%

Buyer's or seller's market?

Months it would take to sell every active home at the pace of the last 6 months.

2.0months of inventory
Seller's, under 4BalancedBuyer's, over 6

Homes are selling quickly, which favors sellers in this market.

Average price by status

Active$1.22M
Under contract$763K
Sold$828K

Average days on market

Active51 days
Under contract93 days
Sold85 days

Browse homes by status

Choose a status to see its numbers, charts and listings.

Active homes

Currently for sale
Homes for sale 2
Average list price $1,216,250
Avg. days on market 51 days
Avg. price per ft² $306
Avg. living area 4,054 ft²
Avg. beds / baths 4.5 / 5.5

Price vs. living area

Each dot is a home. Hover a dot for its address, click it to see the home.

$1.5M$1M$500K$0

Price vs. living area: 2 homes plotted, up to $1.5M and 6,000 ft².

0 ft²2,0004,0006,000 ft²

How long homes have been listed

Number of homes by days on market.

Bedroom mix

Number of homes by bedroom count.

Highest price per ft²

Top 2 homes in this status.

602 Sea Vista Ln.$343
429 Ocean Pointe Ct.$270

All active listings

Click a column to sort
AddressBedsBathsLiving ft²List price$ / ft²Days on market
429 Ocean Pointe Ct.North Myrtle Beach, SC 29582 564,848$1,312,500$27062 days
602 Sea Vista Ln.North Myrtle Beach, SC 29582 453,261$1,120,000$34340 days
allmyrtlebeachhomes.com

Questions about this market?

allmyrtlebeachhomes.com logo

These numbers move every month. For what they mean for your home, or for a home you have your eye on, get in touch.

allmyrtlebeachhomes.com

Next steps

How much is your home worth?

...get instant property value now!

Free and instant. We can follow up with a detailed valuation.

Provided courtesy of The Coastal Carolinas Association of REALTORS®. Information Deemed Reliable but Not Guaranteed. Copyright 2026 of the Coastal Carolinas Association of REALTORS® MLS. All rights reserved. Information is provided exclusively for consumers’ personal, non-commercial use, that it may not be used for any purpose other than to identify prospective properties consumers may be interested in purchasing.